[Please put your name and NetID here.]
Start by downloading HW02.ipynb from this folder. Then develop it into your solution.
Write code where you see "... your code here ..." below. (You are welcome to use more than one cell.)
If you have questions, please ask them in class or office hours. Our TA and I are very happy to help with the programming (provided you start early enough, and provided we are not helping so much that we undermine your learning).
When you are done, run these Notebook commands:
Turn in HW02.ipynb and HW02.html to Canvas's HW02 assignment (use 'Add A File')
As a check, download your files from Canvas to a new 'junk' folder. Try 'Kernel > Restart and Run All' on the '.ipynb' file to make sure it works. Glance through the '.html' file.
Turn in partial solutions to Canvas before the deadline. e.g. Turn in part 1, then parts 1 and 2, then your whole solution. That way we can award partial credit even if you miss the deadline. We will grade your last submission before the deadline.
# ... your code here ... (import statements)
relating the probability an iris has Species='virginica' to its 'Petal.Length' and classifying irises as 'virginica' or not 'virginica' (i.e. 'versicolor').
linear_model.LogisticRegression(C=1000)
so we all get the same results (they vary with C
).# ... your code here ...
Consider the logistic regression model, $P(y _i = 1) = \frac{1}{1 + e^{-(\mathbf{w x} + b)}}\,.$
Logistic regression is named after the log-odds of success, $\ln \frac{p}{1 - p}$, where $p = P(y_i = 1)$. Show that this log-odds equals $\mathbf{w x} + b$. (That is, start with $\ln \frac{p}{1 - p}$ and connect it in a series of equalities to $\mathbf{w x} + b$.)
$\begin{align*} % In this Latex context, "&" separates columns and "\\" ends a line. \ln \frac{p}{1 - p} & = ...\\ & = ...\\ & = ...\\ & = ...\\ & = \mathbf{w x} + b\\ \end{align*} $
I ran some Python/scikit-learn code to make the model pictured here:
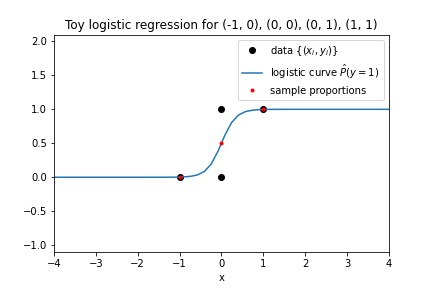
From the image and without the help of running code, match each code line from the top list with its output from the bottom list.
model.intercept_
model.coef_
model.predict(X)
model.predict_proba(X)[:, 1]
A. array([0, 0, 0, 1])
,
B. array([0.003, 0.5, 0.5, 0.997])
,
C. array([5.832])
,
D. array([0.])
# ... Your answer here in a Markdown cell ...
# For example, "1: A, 2: B, 3: C, 4: D" is wrong but has the right format.
Read the data from http://www.stat.wisc.edu/~jgillett/451/data/kaggle_titanic_train.csv.
These data are described at https://www.kaggle.com/competitions/titanic/data (click on the small down-arrow to see the "Data Dictionary"), which is where they are from.
df.dropna()
. Display your data frame's shape before
and after dropping rows. (It should be (714, 4) after dropping rows.)df.Sex == 'female'
. This gives bool values True and False, which are interpreted as 1 and 0 when used in an arithmetic context.max_depth=None
to decided whether a passenger
Survived
from the other three columns. Report its accuracy (with 3 decimal places)
on training data along with the tree's depth (which is available in clf.tree_.max_depth
).max_depth=2
. Report its accuracy (with 3 decimal places).
Use tree.plot_tree()
to display it, including feature_names to make the tree easy to read.# ... your code here ...
# ... your English text in a Markdown cell here ...
Answer in two sentences via print(), with each proportion rounded to three decimal places.
Hint: There are many ways to do this. One quick way is to find the average of the Survived
column for each subset.
# ... your code here ...
Consider a decision tree node containing the following set of examples $S = \{(\mathbf{x}, y)\}$ where $\mathbf{x} = (x_1, x_2)$:
((4, 9), 1)
((2, 6), 0)
((5, 7), 0)
((3, 8), 1)
Find the entropy of $S$.
# ... your brief work and answer here in a markdown cell ...
Find a (feature, threshold) pair that yields the best split for this node.
# ... your brief work and answer here in a markdown cell ...