Description
Dynamic topological data analysis (dynamic-TDA) focuses on analyzing dynamically changing time series data using persistent homology. The method can be applicable to wide variety of dynamically changing data including resting-state functional magnetic resonance images (rs-fMRI) and dynamically changing correlation matrices. The basic terminology and concept are introduced in [1]. If you use data or codes in this page, please reference Songdechakraiwut et al. 2020. Codes below explained in section 1)-3) are packaged as song.2020.simulation3.zip. Section 1)-3) perform the transposition test topological distance on the two-groups setting. Simply run run_simulation_v3.m.1) Modular network simulation
This is the basic statistical model given as Study 2
in the simulation study in Songdechakraiwut
et al. 2020.
Function random_modular_graph.m
will generate a modular network. The input
parameters are as follows.mu = 1; %mean
sigma = .25; %standard deviation
nNode1 = 50; %number of nodes in network G
nModule1 = 2; %number of modules of graph G
nNode2 = 60; %number of nodes in network P
nModule2 = 3; %number of modules of graph P
nModule2 = 3; %number of modules of graph P
G = random_modular_graph(nNode1, nModule1, p, mu, sigma); %network with 2 modules
P = random_modular_graph(nNode2, nModule2, p, mu, sigma); %network with 3 modules
figure; subplot(1,2,1); imagesc(G); colorbar
subplot(1,2,2); imagesc(P); colorbar

Figure 1. Simulated networks with 2 modules and 3 modules. The parameter p controls the probability of connection within the module.
The graphs can be displayed by thresholding the complete graph at 0.5 and displaying them as binary graphs:
Gbinary = adj2bin(G,0.5);
Ggraph = graph(Gbinary)
2) Wasserstein distance on graphs
The Wasserstein distance between two graphs of
different size and topology is first introduced in Songdechakraiwut
et al. 2020.
WS_distance.m computes the sum of 0D and 1D
Wasserstein
distance between
two weighted
adjacency matrices
G and P. >WS_distance(G,P)
ans =
19.9532
WS_distancemat.m computes the topological loss between groups and within groups and represent it as a loss matrix. We will generate two groups. The first group g1 will have 4 networks with 2 modules. The second group g2 will have 6 networks with 3 modules. Since they are topologically different,
nGroup1 = 4;
nGroup2 = 6;
g1 = cell(nGroup1, 1);
g2 = cell(nGroup2, 1);
for k = 1:nGroup1
g1{k} = random_modular_graph(nNode1, nModule1, p, mu, sigma);
end
for k = 1:nGroup2
g2{k} = random_modular_graph(nNode2, nModule2, p, mu, sigma);
end
lossMtx = WS_distancemat('top', g1, g2, []);
figure; imagesc(lossMtx); colorbar
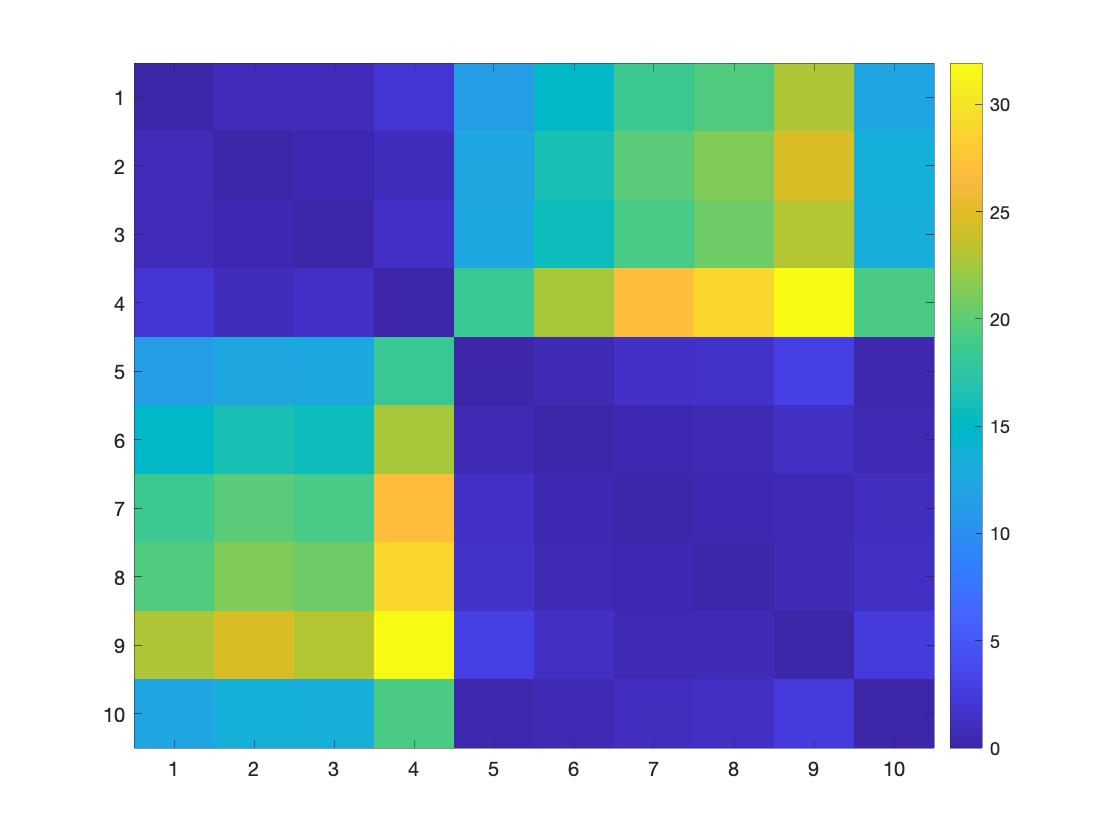
Figure 2. The topological loss within groups is lower than the topological loss between groups.
3) Topological inference on Wasserstein distance
via transpositions
The transposition test on the ratio statistic of
thee between-group loss over within-group loss
is computed as follows (study 2 in Songdechakraiwut
et al. 2020).
An additional weblink for the transposition test is
given here.observed = WS_ratio(lossMtx, nGroup1, nGroup2, @between_over_within)
nTrans = 200000; % number of transpositions
permNo = 500; % intermix random permutation every 'permNo' transpositions
[transStat, ~] =WS_transpostions(lossMtx, nGroup1, nGroup2, nTrans, permNo, @between_over_within);
transPval = online_pvalues(transStat, observed);
pval = transPval(end)
4) Wasserstein clustering on graphs
Figure 1 already shows clustering pattern
indicating the Wasserstein distance can be used in
clustering graphs and networks. We can show that the
clustering using the Wasserstein distance is
equivalent to k-means clustering in a convex domain.
Clustering is performed on a different dataset and
packaged into matlab-WassersteinClustering.zip.
The method is published in [8]. The clustering
accuracy is computed using clustering_accuracy.m
which performs the linear sum assignment problem on
the confusion matrix. The detail is given here.
Reference
[1] Songdechakraiwut, T. Chung, M.K. 2020 Dynamic topological data analysis for functional brain signals, IEEE International Symposium on Biomedical Imaging (ISBI) Workshop 1-4 Shorter abstract
[2] Songdechakraiwut, T. Chung, M.K. 2020 Topological learning for brain networks, arXiv: 2012.00675
[3] Chung, M.K., Huang, S.-G., Songdechakraiwut, T., Carroll, I.C., Goldsmith, H.H. 2020 Statistical analysis of dynamic functional brain networks in twins, arXiv 1911.02731 MATLAB
[4] Kulkarni, A.P., Chung, M.K., Bendlin, B.B., Prabhakaran, V. 2020 Investigating heritability across resting state brain networks via heat kernel smoothing on persistence diagrams, IEEE International Symposium on Biomedical Imaging (ISBI) workshop 1-4.
[5] Huang, S.G., Chung, M.K., Qiu, A, ADN Initiative 2020 Revisiting convolutional neural network on graphs with polynomial approximations of Laplace-Beltrami spectral filtering, arXiv:2010.1326
[6] Huang, S.G., Chung, M.K., Qiu, A, ADN Initiative 2020 Fast mesh data augmentation via Chebyshev polynomial of spectral filtering, arXiv:2010.02811
[7] Chung, M.K., Xie, L., Huang, S.-G., Wang, Y., Yan, J., Shen, L. 2019. Rapid Acceleration of the permutation test via transpositions, International Workshop on Connectomics in NeuroImaging, Lecture Notes in Computer Science 11848:42-53. A different version arXiv:1812.06696
[8] Anand, D.V., Dakurah, S., Wang, B., Chung, M.K. 2021 Hodge-Laplacian of brain networks and its application to modeling cycles. arXiv:2110.14599
